 |
|
|
|
 |
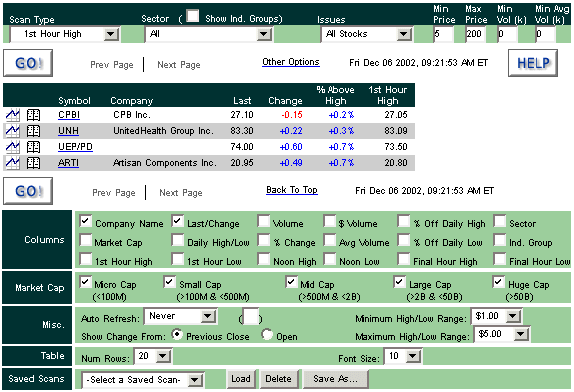
Rally Scan Discover breakout opportunities in real-time. Use a variety of criteria to identify which stocks are exhibiting breakout behavior. Learn which stocks exceed the high/low set in the first hour of trading or at noon. See which stocks are rallying at the end of the day by reaching new highs/lows. Control your results by displaying the information that is critical to you including company name, last, change, percent change, change from previous close or open, daily or year high and low, volume and average volume, number of trades, bid/ask spread and market capitalization. You can access charts, news and company research directly from your scan page. What's more, the results can be easily copied into eSignal for further analysis.
There are two types of scans - Trading and Breakout.
The Trading Scans rank the results
by order of magnitude with the largest moves listed first. These scans
will identify those stocks that have had large moves above or below a
range either following the first hour of trading or following the trading
at noon.
The Breakout Scans will
identify those stocks that are just breaking above or below a range either
following the first hour of trading or following the trading at noon. The
stocks closest to the breakout level are ranked first.
The main difference between the Trading Scan and the Breakout Scan is
the order they are sorted. The breakout scan sorts the data and puts those
issues that have exceeded the high by the smallest amout/percent at the
top of the list. The trading scan takes the same data and sorts it so
those issues that have exceeded the high by the most amount/percent are at
the top. The list of issues for the Breakout Scan is the same list of
issues in the Trading Scan in reverse order.
Trading:
Breakout:
Allows you to view stocks belonging to certain sectors or industry groups.
Allows you to set price brackets (i.e., minimum/maximum dollar value per share) to focus on stocks best suited to your trading needs.
The Min Volume is used to select stocks whose daily traded volume exceeds the specified value. For example: If Min Volume is set to 100k, this means a stock has to trade over 100,000 shares to be included in the scan. The Avg Volume is used to select stocks whose last 20 day average volume exceeds the specified value. For example: If Avg Volume is set to 2000k, this means a stock has to trade over 2,000,000 shares average per day over the last 20 days to be included in the scan. Helpful for weeding out very thinly traded stocks whose movements are not supported by sufficient volume for trading.
Allows you to display the next set of issues that meet your criteria.
Takes you to the table at the bottom of the page where you can select more options.
Table which displays the issues that meet your criteria, as well as any additional information which you have selected in the Columns option.
Allows you to select additional information to be displayed for each issue which meets your criteria.
Allows you to eliminate stocks whose market capitalization are outside the specified boundaries.
Allows you to save all your current settings and restore them later. You may have up to 10 saved scans.
|
| [Basic Scan] [Power Scan] [Pre Market] [Rally Scan] [Hot Groups] |
|